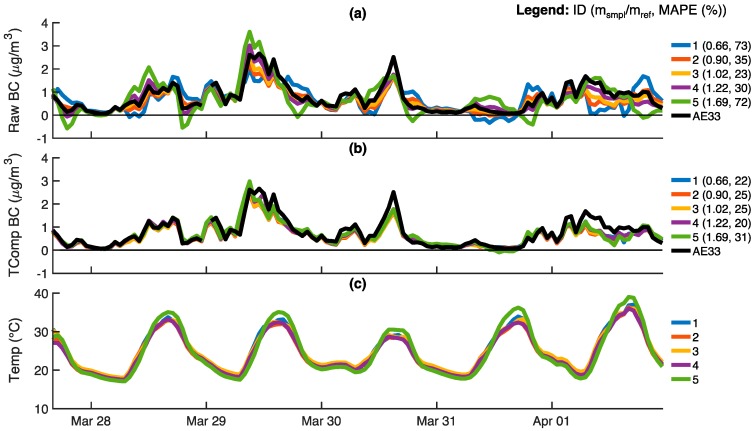
Figure 9.
Five ABCD units operating outdoors atop a Bay Area Air Quality Management District near-roadway monitoring station: (a) Uncompensated black carbon (BC) concentrations; (b) Temperature-compensated BC concentrations; (c) Optical cell temperatures. Also shown are BC concentrations reported by a Magee Scientific AE33 housed inside the monitoring station (black). All data is provided on a 60-min time base. For each ABCD, the legend shows the slope ratio of the optical cell and mean absolute percent error (MAPE) of the BC measurements, the latter of which is based on deviations from BC concentrations reported by the AE33 reference instrument. The five ABCDs shown in this figure are different than those presented in Figure 7.

