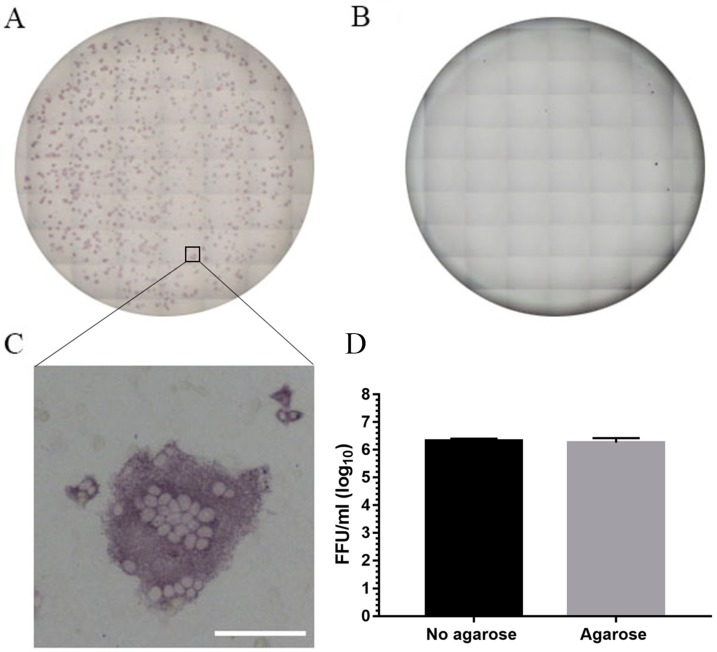
Figure 2.
Light microscopic images showing distribution and characteristics of PEDV plaques in immunoplaque assay. (A) Virus-positive well showing plaques on Vero 76 cells infected with PEDV; (B) un-infected control well; (C) high magnification of a typical plaque showing viral-induced syncytium (Scale bar: 100 μm); (D) comparison of immunoplaque assay with and without agarose overlay. Data presented are average ± SEM from two independent experiments.

