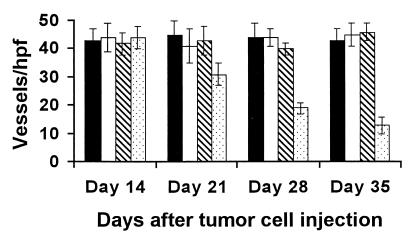
Figure 5.
Sequential analysis of inhibition of angiogenesis within tumors. Mice treated were killed on days 14, 21, 28, and 35 after tumor cell injection. Vessel density was determined by counting the number of microvessels per high-power field in the sections stained with an antibody reactive to CD31, as described in Materials and Methods. Treatment with MVEGF-p (solid bar), e-p (open bar), saline alone (striped bar), XVEGF-p (dotted bar). The data are expressed as means ± SEM.

