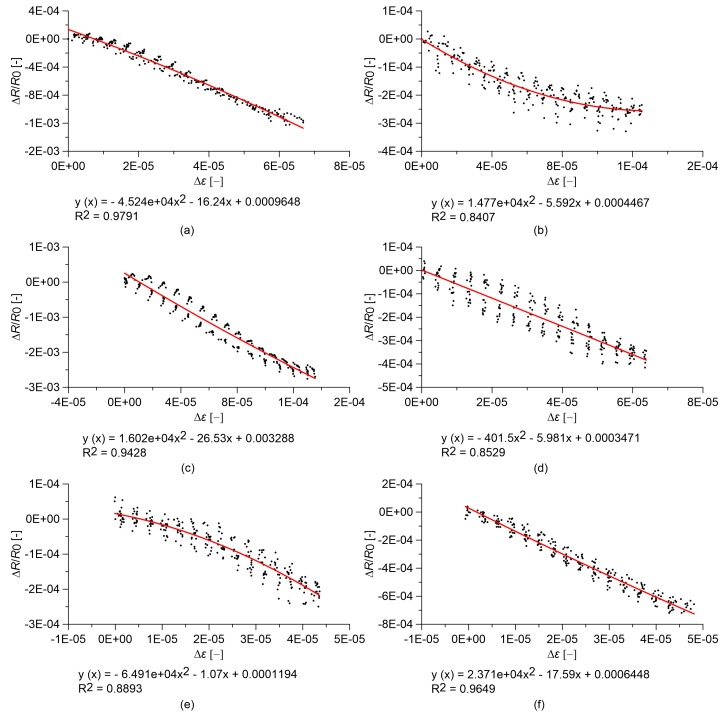
Figure 5.
Relative change in electrical resistance versus applied strain of nanocomposite cement paste specimens under quasi-static compression loads. In the plots, R0 is the electrical resistance value with a preload of 0.5 kN, and equations of quadratic regression lines are reported: cured paste with (a) 0.00% MWCNTs; (b) 0.25% MWCNTs; (c) 0.50% MWCNTs; (d) 0.75% MWCNTs; (e) 1.00% MWCNTs; (f) 1.50% MWCNTs.

