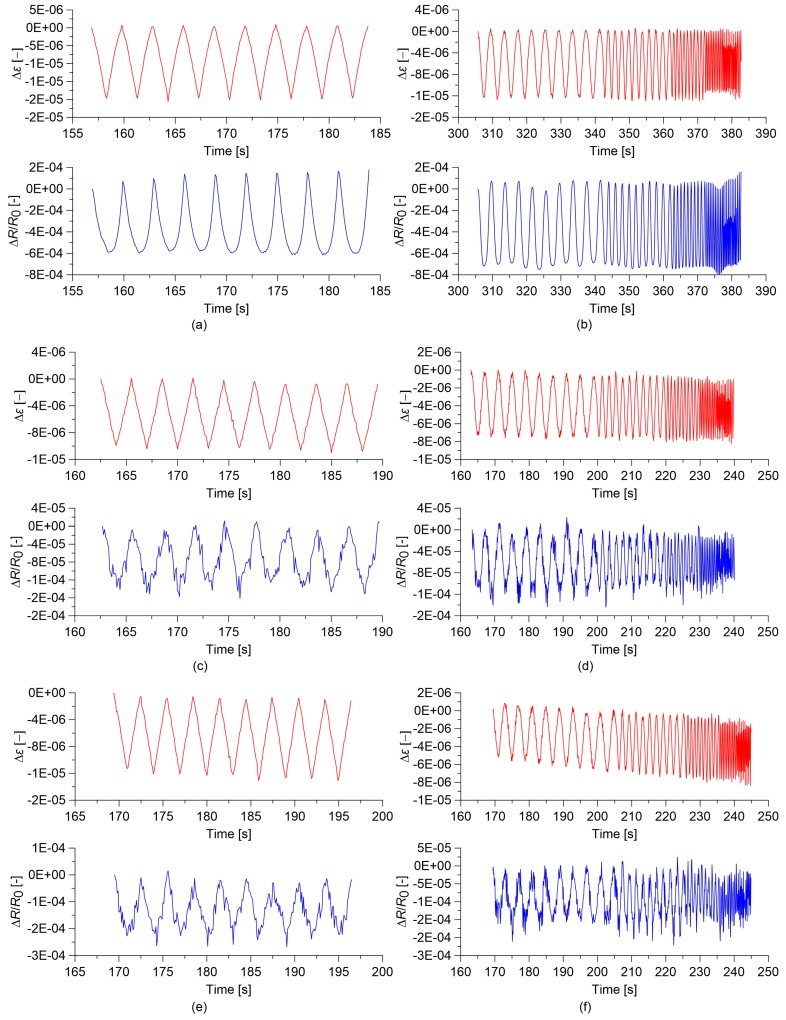
Figure 9.
Time histories of the relative change in electrical resistance, ΔR/R0, and of the applied strain, Δε, obtained from the electromechanical tests. In the plots, R0 is the electrical resistance value with a preload of 0.5 kN: (a) Quasi-static load applied on concrete with 0.00% MWCTs; (b) Sine-sweep dynamic load applied on concrete with 0.00% MWCNTs; (c) Quasi-static load applied on concrete with 0.50% MWCNTs; (d) Sine-sweep dynamic load applied on concrete with 0.50% MWCNTs; (e) Quasi-static load applied on concrete with 1.00% MWCNTs; (f) Sine-sweep dynamic load applied on concrete with 1.00% MWCNTs.

