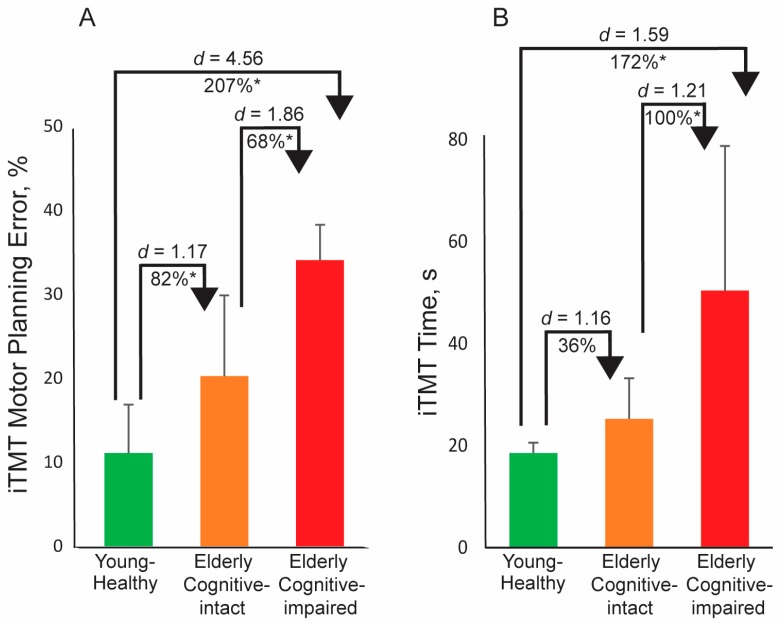
Figure 3.
The iTMT derived parameters for all groups, including young-healthy group, elderly cognitive-intact group, and elderly cognitive-impaired group. (A) The iTMT MPE comparison; (B) the iTMT time comparison. Error bar represents the standard error. ‘*’ denotes when the pairwise group comparison achieved a statistically significant level (p < 0.050). d denotes Cohen’s d effect size.

