
Figure 1. Distribution of Two-Day Cath Rates by HRR.
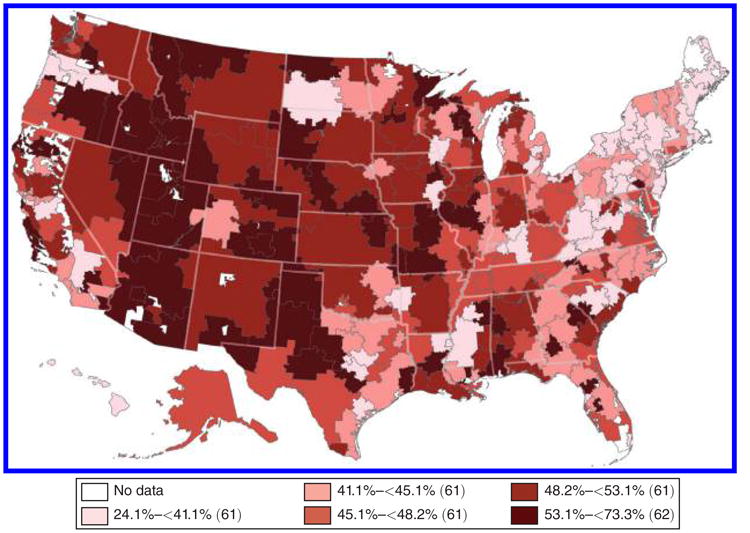
Notes: Map shows the geographic distribution of two-day cardiac catheterization rates among Medicare heart attack (AMI) patients across the 306 Hospital Referral Regions (HRRs). Cath rates are calculated over pooled years 1998–2012 and weighted by the number of AMI patients treated in each region during this period. Rates are risk-adjusted for patient age, race, sex, and first heart attack.