
Figure 2. Distribution of Changes in Two-Day Cath Environment across Move.
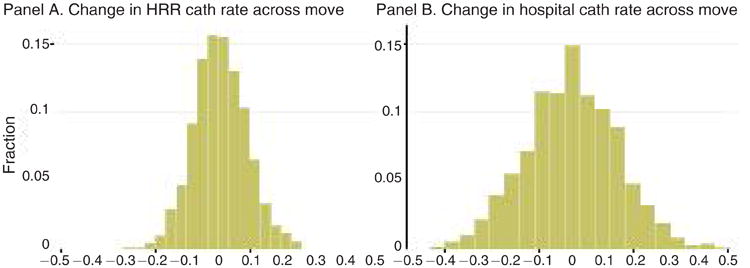
Notes: Figure 2 shows the distribution of changes in cath environment among cardiologists who move HRRs. In panel A, the change for cardiologist j is defined as Δj = (destination HRR cath intensity)j – (origin HRR cath intensity)j, defined as a physician-leave-out mean that omits physician j's own patients from the risk-adjusted HRR cath rates shown in Figure 1. Panel B shows the analogous distribution of changes in hospital cath intensity across the move based on the hospitals where the physician's patients were admitted. In both panels, the distribution is weighted by the number of sample heart attack patients treated by cardiologist movers.