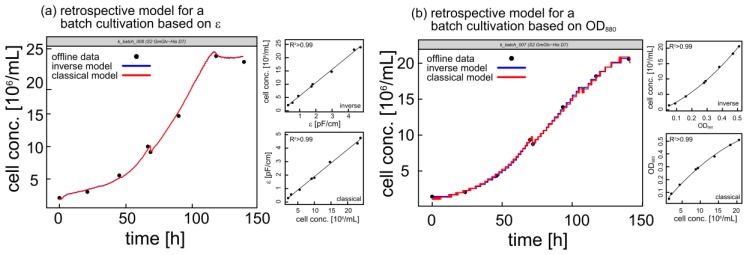
Figure 3.
Offline cell density (black dots) and corresponding growth curves based on inverse (blue line) and classical (red line) calibrations for two representative batch cultivations. Smaller panels show corresponding calibration curves. (a) Permittivity-based retrospective models for cultivation k_batch_008. (b) OD880-based retrospective models for cultivation k_batch_007. The kinks at ~70 h represent induction with 600 µM copper sulfate.

