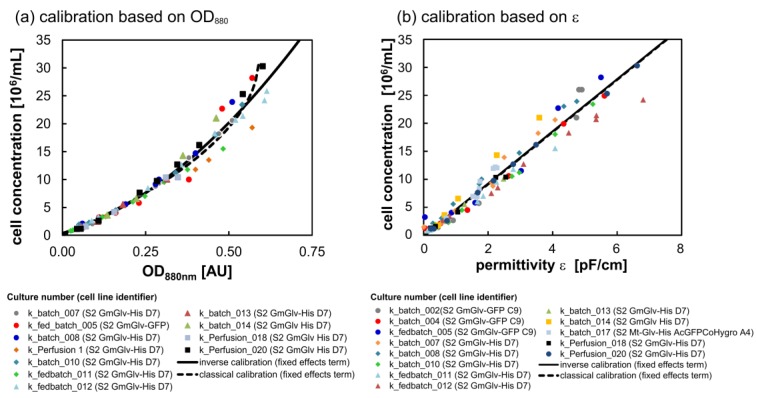
Figure 4.
Calibration using the fixed effects terms of the classical and inverse LME models. (a) Scatter plot of measured viable cell concentration and the signal of the EXcell 230 NIR turbidity sensor based on exponentially growing populations. (b) Correlation between measured viable cell concentration and the Incyte permittivity ε (1000–10,000 kHz) based on exponentially growing populations.

