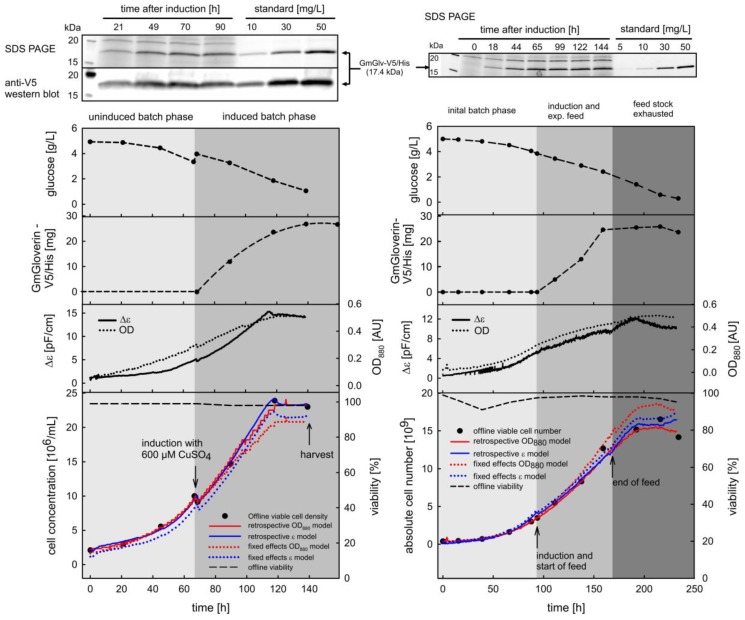
Figure 5.
Growth curves and corresponding process data for representative batch (left panel, batch_008) and fed-batch (right panel, fed_batch_011) processes for the production of GmGlv in the cell line S2 GmGlv-His-D7. The lower panel shows the inverse LME (dotted) and inverse retrospective (solid lines) models for biomass estimation based on OD880 (red) or ε (blue). Note that the last point of the GmGlv concentration in the batch culture originates from the small amount of culture broth that was further cultivated after harvest.

