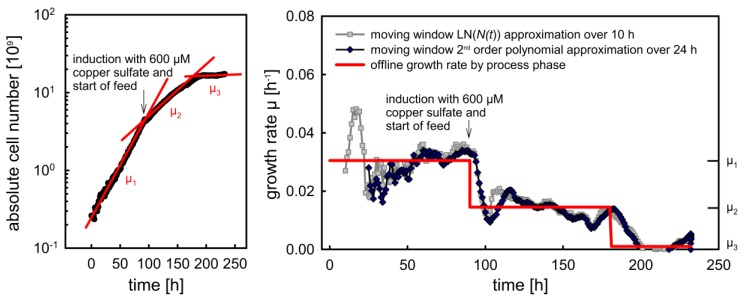
Figure 6.
Growth rate calculation based on of cell numbers that were predicted with the inverse fixed effects model and the ε data for cultivation fed_batch_011. Offline calculation of averaged growth rates according to three different process phases (left panel and red line in the right panel), moving window-based calculations (right panel, gray and dark blue lines).

