Figure 7.
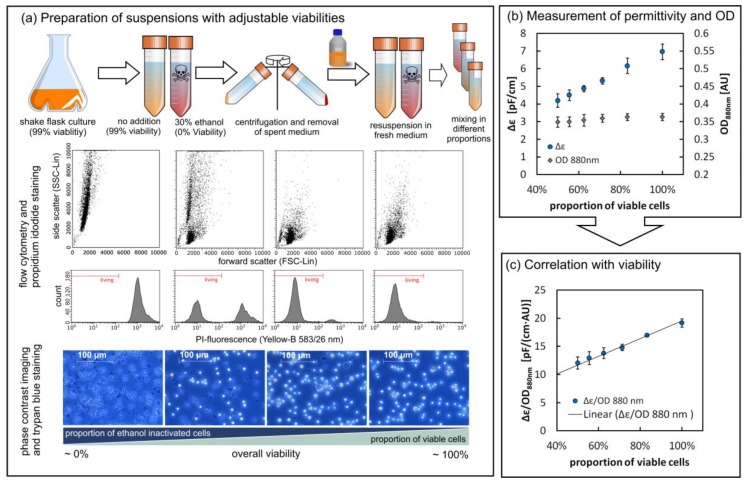
Viability assessment via the parallel measurement of turbidity and permittivity in a controlled environment. (a) Preparation of cell suspensions with different viabilities and analysis of the resulting cell pools via flow cytometry and microscopy. (b) Raw signals of Δε and OD880nm show the different responses of the sensors (n = 4, mean ± SD). (c) The ratio of the two signals shows linear dependence on the viability of the cell suspension (n = 4, mean ± SD).

