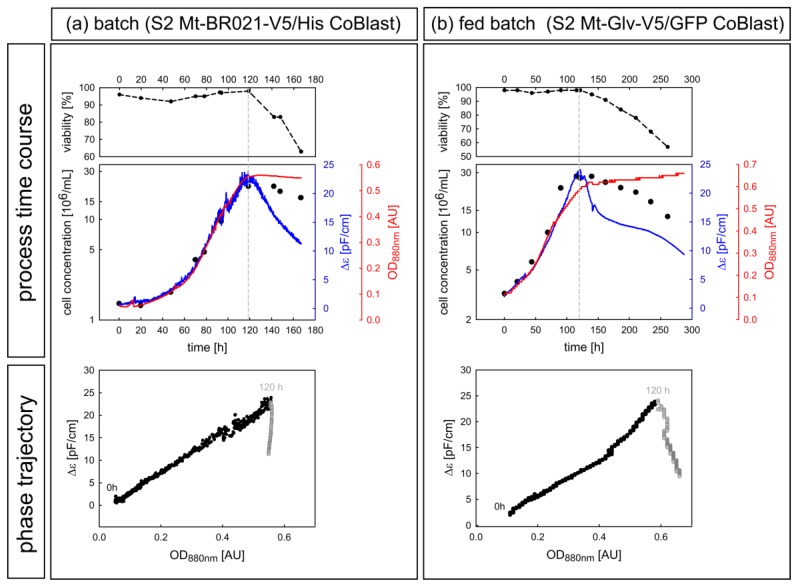
Figure 8.
Growth and offline viability curves for prolonged batch (a) and fed-batch (b) cultivations for the two different cell lines S2 Mt-BR021-V5/His (k_batch_016) and S2 Mt-Glv-V5/GFP (k_fed_batch_005). Induction commenced at 92 h and 120 h, respectively. After entering the stationary phase and the depletion of essential nutrients, the cell population lost viability. The transition from active to decaying culture is visible in the corresponding Δε-OD880 phase trajectories. Black dots represent the process before 120 h, followed by gray dots for subsequent time points (lower panel).

