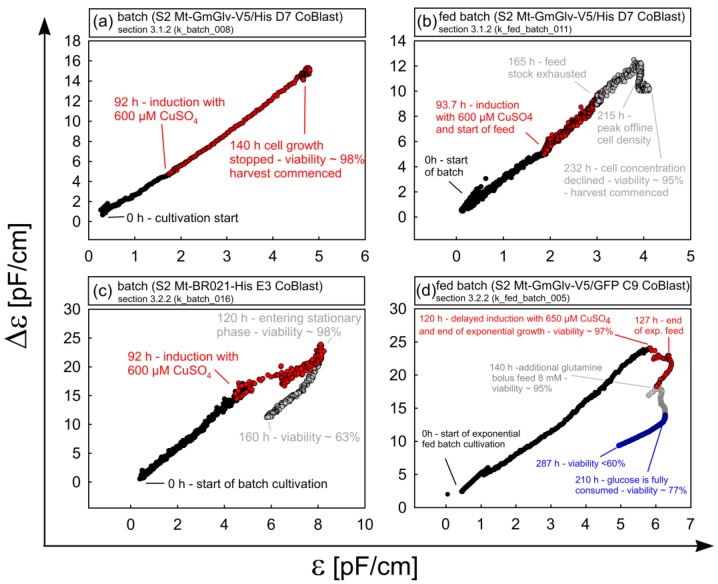
Figure 9.
Analysis of the representative cultivations described in Section 3.1.2 (batch_008, fed_batch_011) and 3.2.2 (batch_016, fed_batch_005) by plotting the ε-Δε phase trajectories. Healthy and exponentially growing batch (a) and fed-batch (b) cultures show a predominantly linear relationship between ε and Δε. Prolonged cultures with nutrient depletion (late stage b–d) show altered trajectories reflecting physiological changes in the cell population. Different process phases and key transition points are highlighted.

