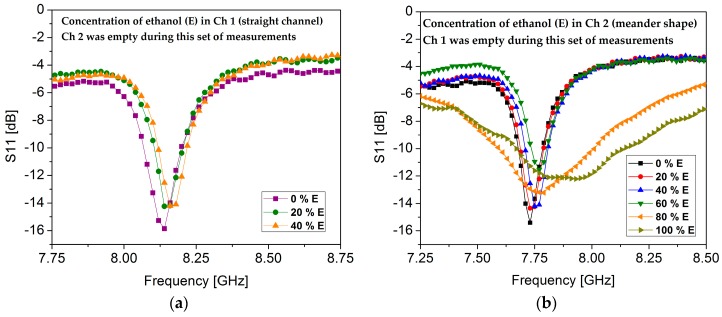
Figure 10.
The measured concentrations of ethanol (E) in each channel were analyzed to determine the sensitivity in terms of limit of detection (LOD). (a) Concentrations of ethanol in Ch 1 (straight channel) while keeping Ch 2 empty. The LOD of Ch 1 was measured to be 30% ethanol; (b) Concentrations of ethanol in Ch 2 (meander shaped) while keeping Ch 1 empty. The LOD of Ch 2 was measured to be 10% ethanol.

