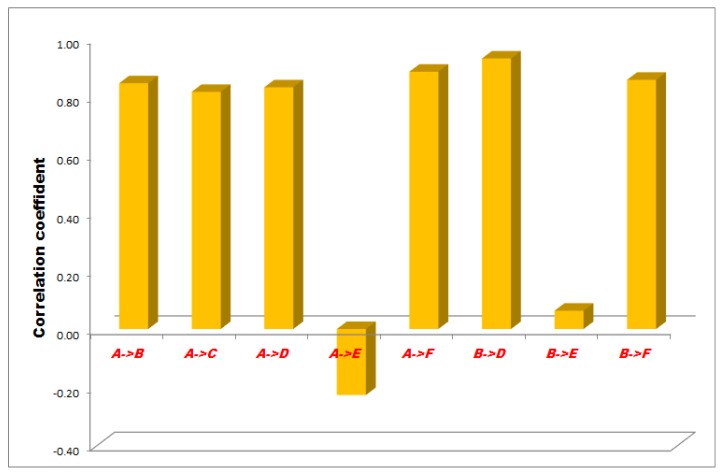
Figure 4.
Results of statistical (correlation) analysis between the different sensor pairs during NPWT applying at 100 mmHg suction. Sensors represent exact measurement points in the abdominal cavity. A: midline, above the layer; B: midline, under the layer; C: laterally, above the layer; D: laterally, under the layer; E: midline, among the bowels; F: laterally, among the bowels.

