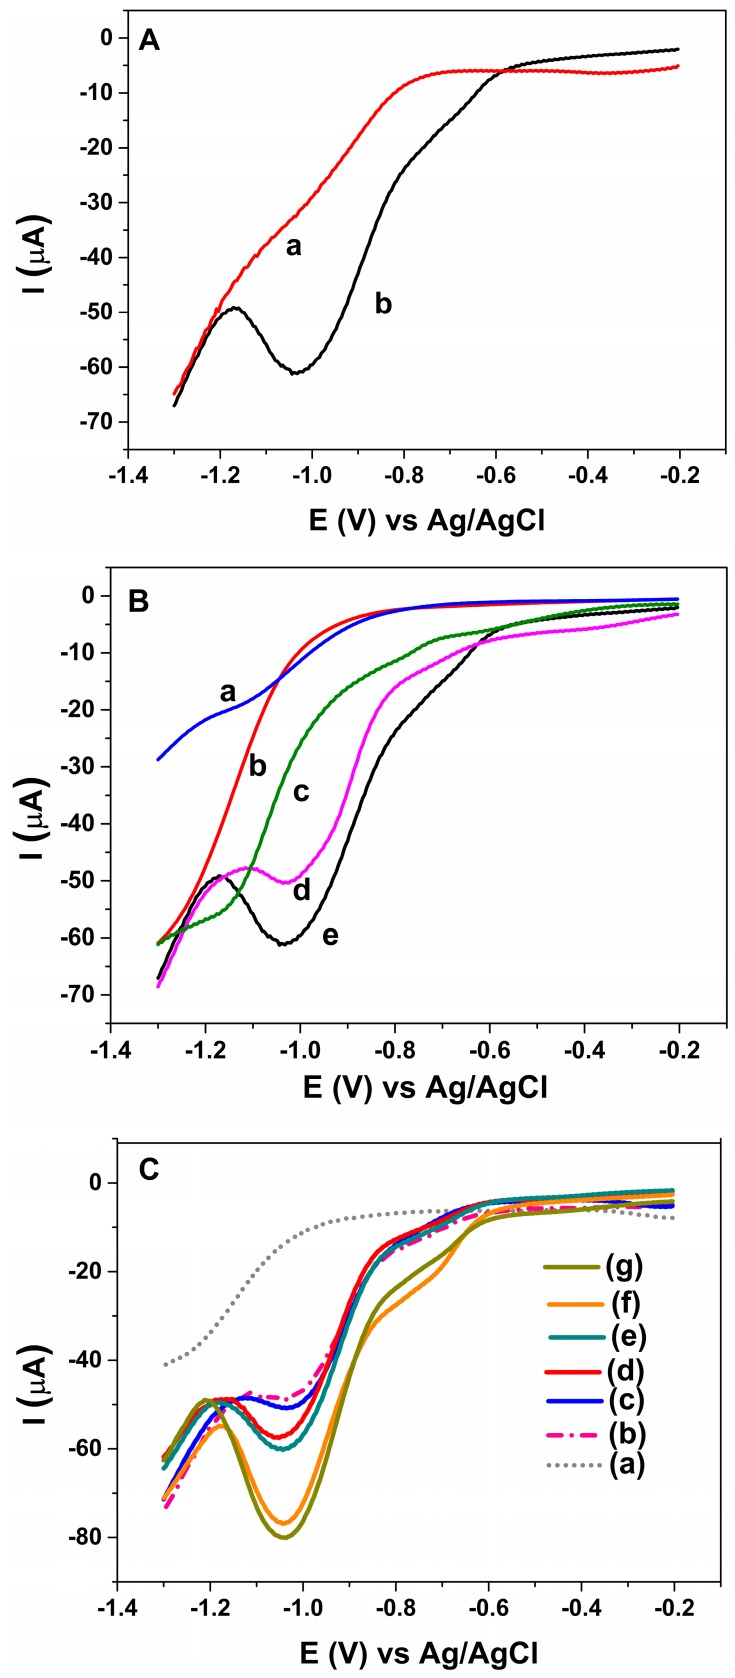
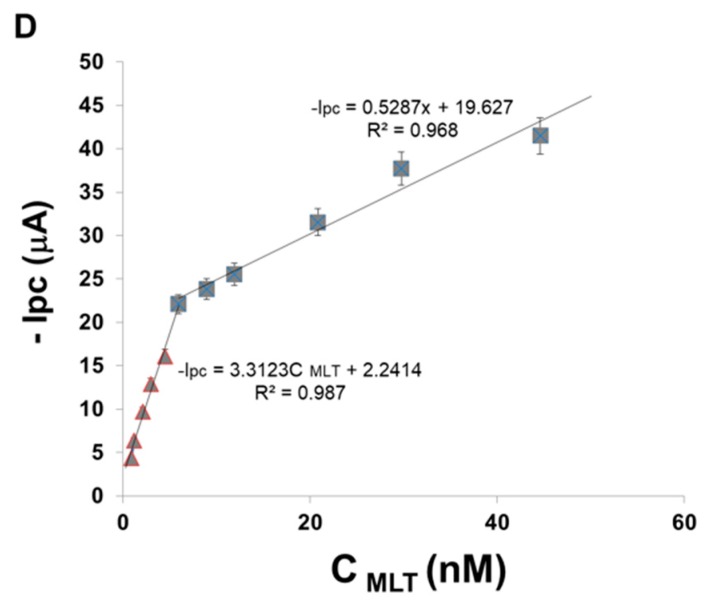
Figure 5.
SWVs for (A) AuNP-CS-IL/PGE in pH 7.0 BR buffer containing (a) 0 nM (b) 3 nM MLT; (B) (a) bare Au disc electrode (b) bare PGE (c) CS-IL/PGE (d) AuNP/PGE (e) AuNP-CS-IL/PGE in pH 7.0 BR buffer containing 3 nM MLT (Accumulation time: 300 s); (C) SWVs of MLT at AuNP-CS-IL/PGE in pH 7.0 increasing concentrations of MLT (from a to g): 0.0; 2.97; 8.9; 14.9; 20.8; 44.5; 50.0 nM; (D) calibration graph corresponding to MLT concentrations vs. peak currents (Accumulation time: 300 s).


