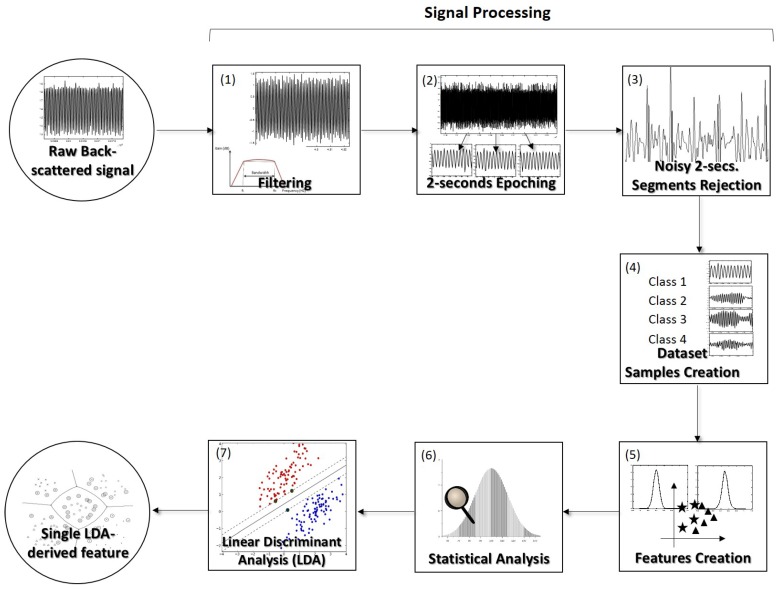
Figure 5.
Scheme explaining all the back-scattered signal processing and analysis steps. (1) At first each 120-s whole acquisition was filtered using a second-order 500 Hz Butterworth high-pass filter. (2) Then, each entire acquisition corresponding to each particle from each class was split in 2 s signal epochs. (3) In order to remove the noisy portions, each signal portion was z-scored and discarded if one of its values exceeded . (4) After these steps, it was possible to obtain a dataset with 2 s signal portions with a reasonable SNR for the particles type differentiation to be possible. Class 1—“no particle trapped”; Class 2—“PMMA particle trapped”; Class 3—“Polystyrene particle trapped”; Class 4—“Living yeast cell trapped”. (5) Then, the 45 signal-derived features to be evaluated were computed. (6) Those were studied using statistics. (7) The most relevant information present in the original features set was gathered into a single one, using the dimensionality reduction technique Linear Discriminant Analysis (LDA).

