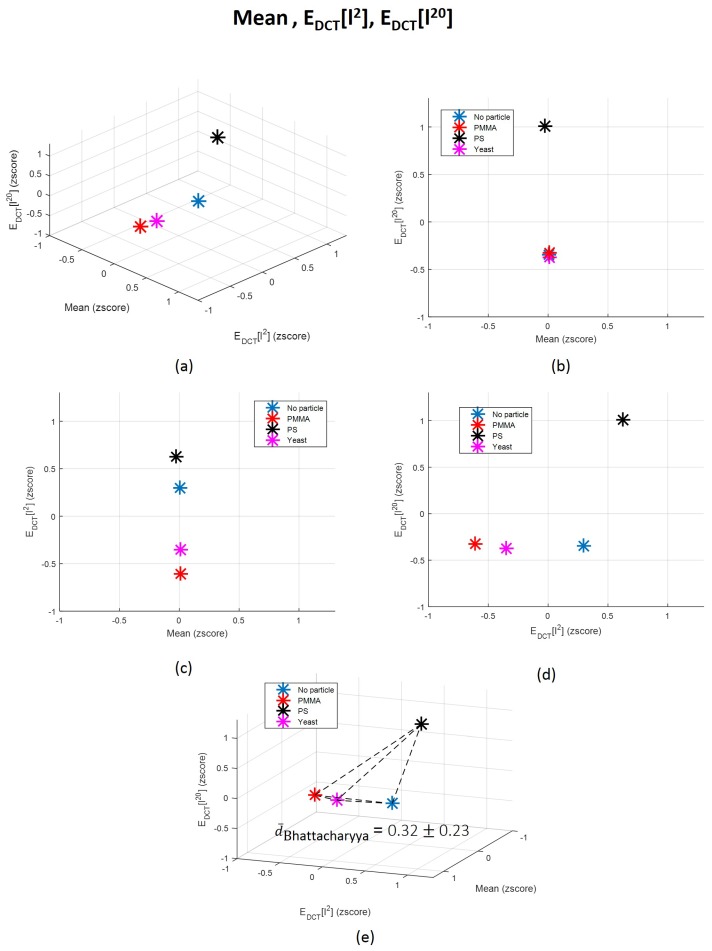
Figure 13.
(a) 3-dimensional representation of the three original features (, and ) whose information contributed the less for the final LDA-derived one; (b–d) 2D decompositions of the 3D space; and (e) correspondent average Bhattacharyya distance between each pair of classes distributions and graphical representation of each distance norm. Each point represents the mean value in the 3D space corresponding to each class: “Class 1: No particle”, “Class 2: PMMA”, “Class 3: PS” and “Class 4: Yeast”. ; ; ; ; ; .

