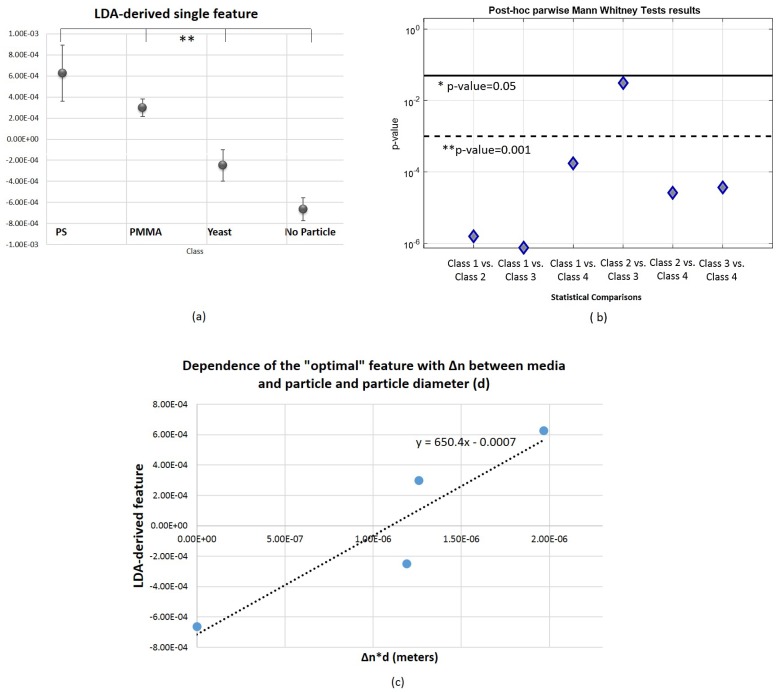
Figure 14.
Statistical comparison between 4 classes and post-hoc parwise results for the obtained LDA-derived single feature and its dependence with between media and each particle; and particle diameter (d). (a) Results of the Kruskal-Wallis test. Vertical axis is in logarithmic scale. ** . * . (b) Graphical representation of p-values obtained in the post-hoc parwise analysis using the Mann Whitney test. Vertical axis is in logarithmic scale. ** . * . (c) LDA-derived feature versus , in which d is the particle diameter in meters, and corresponding fit line. Spearman correlation results (two-tailed): ; .

