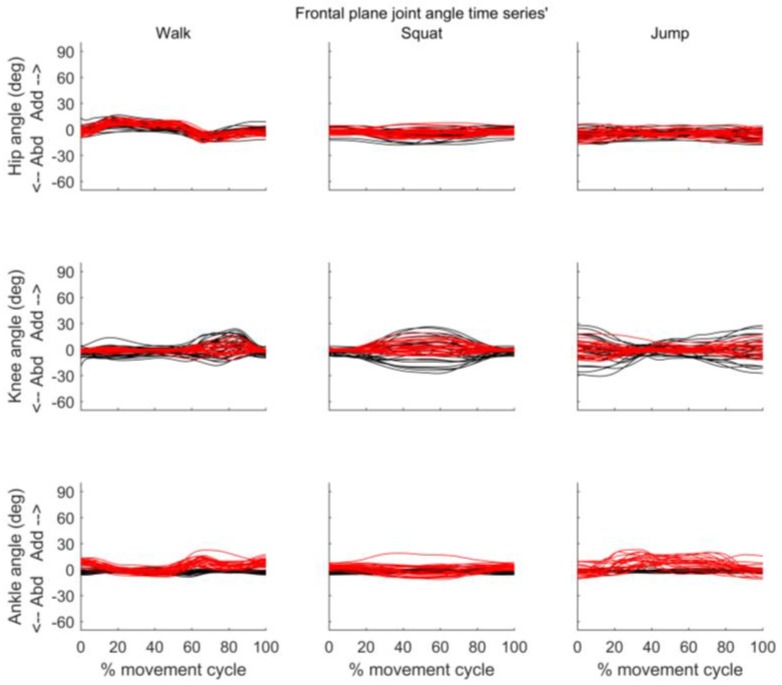
Figure 6.
Frontal plane joint angles throughout the movement cycle for each participant. Time series of hip (top row), knee (middle row) and ankle (bottom row) joint angles obtained from VICON (black) and MVN BIOMECH (red) systems for each participant during walk (left), squat (centre), and jump (right). Y-axis represents joint angles in degrees and X-axis represent the movement cycle in percentage. Y-axis scale is the same as in Figure 5 to allow comparison.

