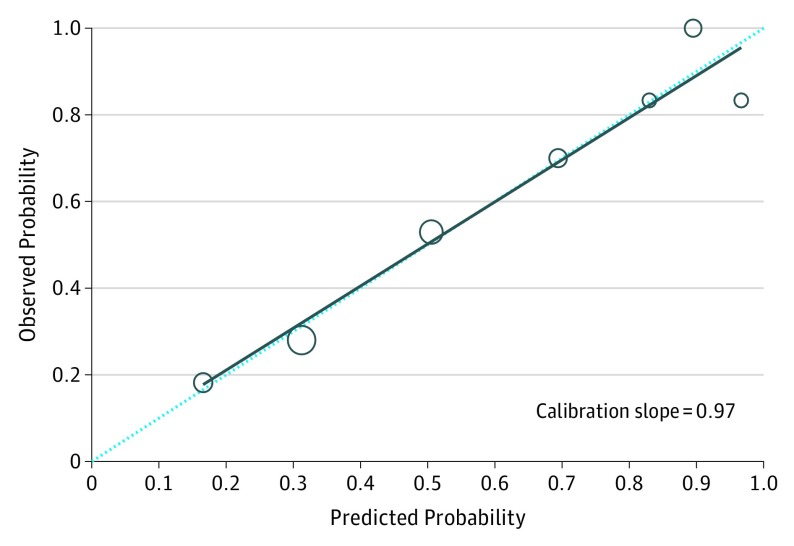
Figure 2. Calibration Plot Based on Risk Features of the Breuninger et al Staging System.
Calibration plot of observed proportion against predicted probability of having metastasis in patients with cutaneous squamous cell carcinoma, based on risk features in the Breuninger et al staging system. The dotted diagonal lines represent the ideal line where the actual probability of metastasis matches the predicted probability. The larger circles indicate that these points are based on more data.

