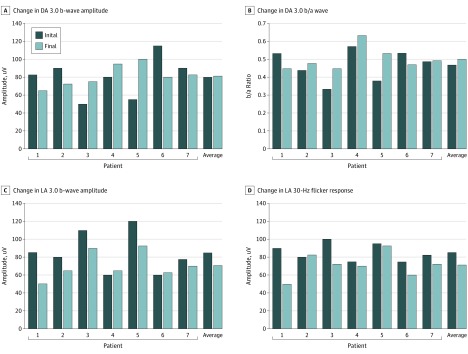
Figure 3. Change in Electroretinogram for Each Individual Patient and Average for Cohort.
A, Change in dark-adapted (DA) 3.0 b-wave amplitude (P = .90). B, Change in DA 3.0 b/a wave (P = .78). C, Change in light-adapted (LA) 3.0 b-wave amplitude (P =.07). D, Change in LA 30-Hz flicker response (P = .07). While the average change for the cohort was greatest for LA responses, it was not statistically significant.

