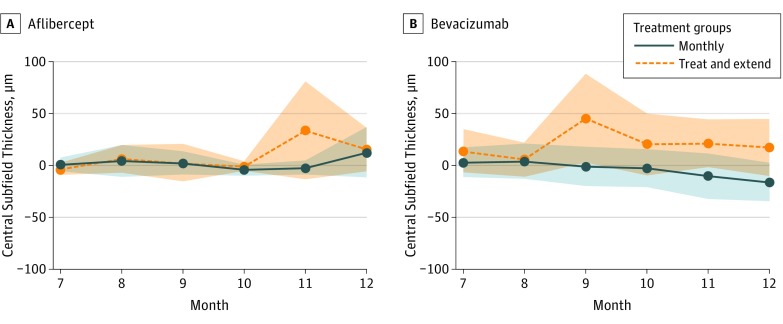
Figure 4. Central Subfield Thickness Mean Change in Months 7 Through 12.
A and B both depict means from months 7 through 12 only. Each mean line is surrounded by a shaded area depicting pointwise 95% CIs about the means. The overlap between the shaded areas roughly depicts times when the means do not statistically differ.

