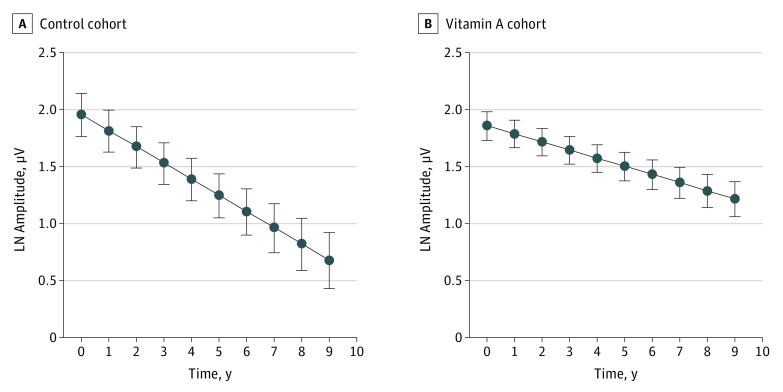
Figure. Plot of Predicted Loge Cone Electroretinogram (ERG) Amplitude .
Plot of predicted loge cone ERG amplitude (mean [SE]) over 9 years of follow-up by cohort based on Model 1 estimates using the MIXED procedure of SAS and the outpred option. Estimates derive from data of 25 children (control cohort) and 55 children (vitamin A cohort). Note that the abscissa plots actual (not mean-centered) time; therefore, the plotted intercepts differ from the intercepts listed in Table 2. LN indicates natural logarithm.

