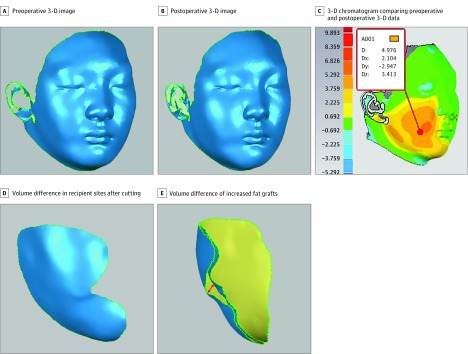
Figure 2. Three-Dimensional (3-D) Volumetric Analysis.
The arrowhead in E indicates the spatial region between the preoperative and postoperative models, which can be regarded as the volume difference of the increased fat grafts. D indicates distance; Dx, x-axis distance; Dy, y-axis distance; Dz, z-axis distance.

