
Figure 5. High glucose stimulation of beta cells inhibits pericytes and dilates capillaries through adenosine and A1 receptors.
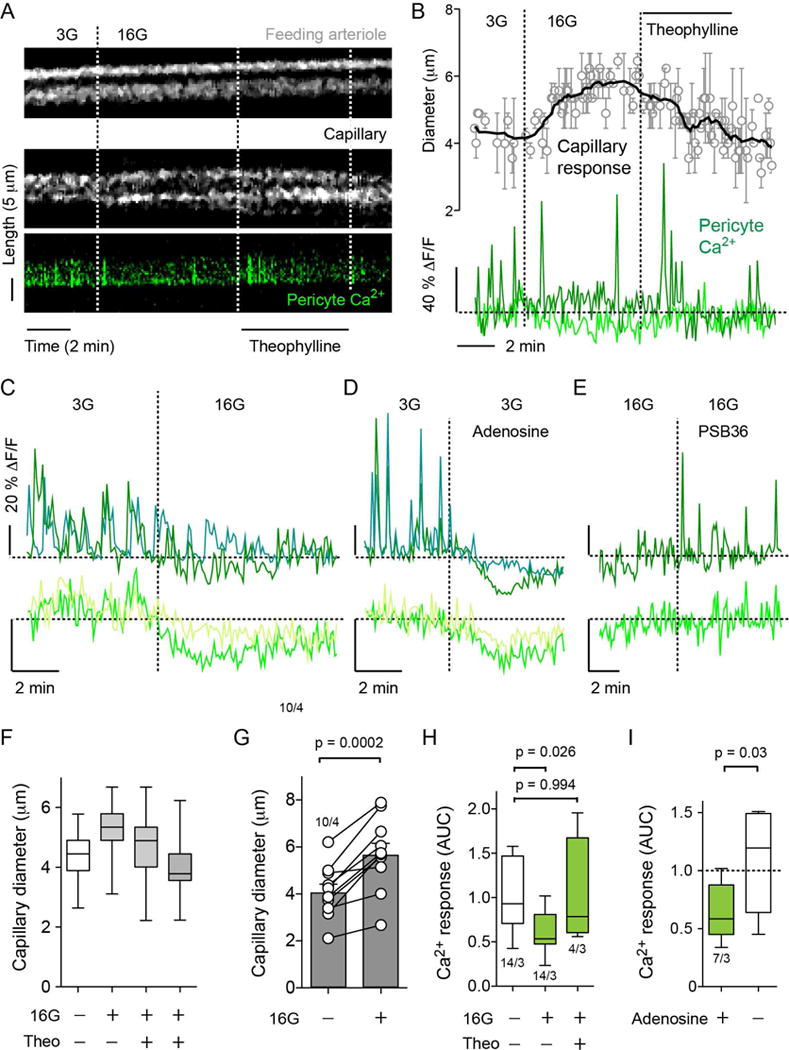
(A) Temporal projections of line scans showing changes in vessel diameter (upper and middle panels) of a feeding arteriole (upper panel) and an islet capillary (middle panel) and of cytosolic Ca2+ levels in a nearby capillary pericyte (green, lower panel) induced by increasing extracellular glucose concentration from 3 mM (3G) to 16 mM (16G) in a living pancreatic slice. High glucose increased capillary, but not arteriole, diameter and simultaneously decreased cytosolic Ca2+ in the pericyte. Theophylline (20 μM, in 16G), a non-specific antagonist of adenosine receptors, reversed the effects of high glucose.
(B) Traces of responses as in (A) show the average change in vessel diameter (upper panel, N = 3 capillaries) and cytosolic Ca2+ levels in pericytes (lower panel). Dashed line on Ca2+ traces shows the zero value. Each trace corresponds to one pericyte.
(C–E) Traces showing changes in cytosolic Ca2+ levels in islet pericytes induced by (C) high glucose (16 mM, 16G), (D) adenosine (50 μM) in 3 mM glucose and (E) A1 adenosine receptor antagonist (PSB36, 100 nM) in 16 mM glucose. Changes in baseline cytosolic Ca2+ levels (lower panel) are shown at a higher gain. Y-axis bars correspond to 20% change (ΔF/F). Each trace corresponds to one pericyte. Horizontal dashed lines show the zero value, and vertical dashed lines when stimuli were applied.
(F) Quantification of the changes in capillary diameter of a responsive capillary induced by high glucose (16G) and the reversal by theophylline (Theo; in 16G) 2 min and 5 min after application of the antagonist.
(G) Quantification of the changes in capillary diameter induced by 16 mM glucose. Each pair of symbols is one capillary (N = 10 capillaries pooled from 4 slice preparations, paired t-test).
(H) Quantification of changes in cytosolic Ca2+ levels in pericytes induced by high glucose (16G) and high glucose plus theophylline (Theo, 20 μM). The area under the curve (AUC) was quantified in a 4-5 min recording in each condition. N = 4–14 pericytes from 3 slice preparations, one-way ANOVA corrected for multiple comparisons.
(I) Quantification of the changes in cytosolic Ca2+ levels in pericytes induced by adenosine (50 μM). Area under the curve (AUC) was quantified in 3 min recordings before, during and after adenosine. Data are scaled to AUC values before adenosine application (dashed horizontal line). N = 7 pericytes from 3 slices preparations, paired t-test.