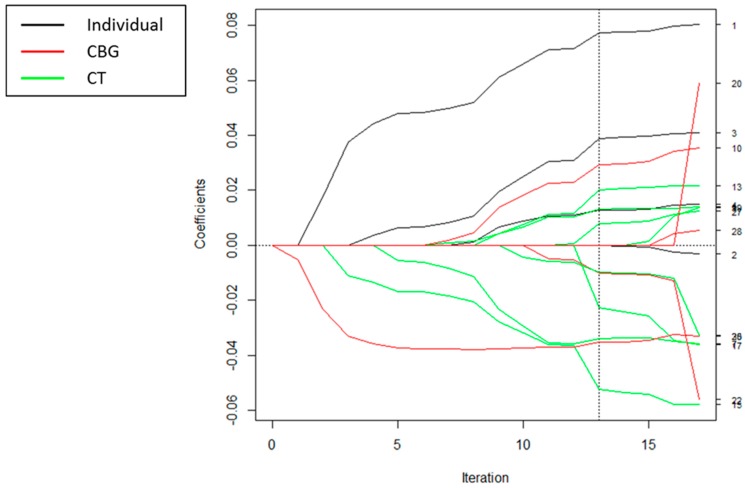
Figure 4.
Coefficient paths for spatial scale least angle regression (LARS)/lasso to explain BMI z-scores. The scale at which each covariate entered the model is indicated by the legend. The numbers on the right-hand side of the figure are the variable numbers listed in Table 1. The dotted vertical line indicates the chosen model that had the minimum ordinary least squares (OLS)-based Akaike’s information criterion (AIC).

