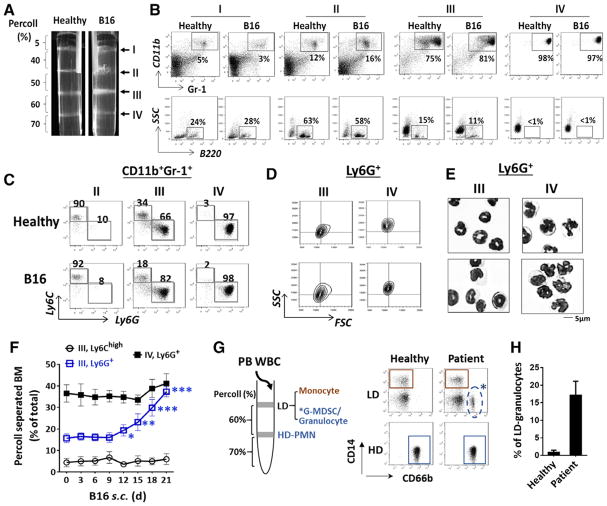
Figure 1.
Separation of bone marrow myeloid leukocytes by Percoll density gradients. (A) Bone marrow cells harvested from healthy and B16 melanoma-bearing mice were applied to discontinuous Percoll density gradients. After centrifugation, four cell-enriched bands, I, II, III, IV, were formed at sequentially increased density interfaces. Representative flow cytometric (B) analyses of cell types in each band. (C) Determination of monocytic and granulocytic cells in the Gr-1+CD11b+ myeloid population by Ly6C and Ly6G labeling. (D) Analyses of Ly6G+ granulocytes in bands III and IV for FSC and SSC values. (E) Giemsa staining of Ly6G+ granulocytes for nuclear morphology. Scale bar: 5 μm. Data in (A–E) are from a single experiment representative of over five independent experiments with three to five mice per experiment. (F) Progressive expansion of band III Ly6G+ granulocytes in mice engrafted with B16 melanoma. (G–H) Separation of human peripheral leukocytes by Percoll density gradients and FACS analyses of granulocytes (CD66+) and monocytes (CD14+) in high density (HD) and low density (LD) fractions. Data in (F, H) are expressed as median ± SEM and represent over five independent experiments with five mice or patients per experiment. The significant differences between the tested groups were calculated by two-tailed paired Student’s t-test. *p ≤ 0.05; **p ≤ 0.01; ***p ≤ 0.001.

