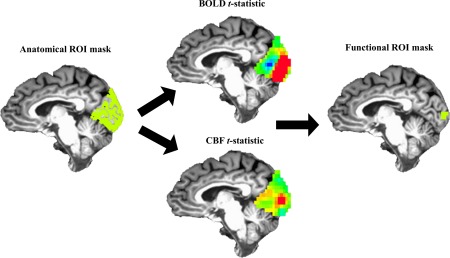
Figure 3.

Graphical overview of masking procedure. Top 5%, overlapping BOLD and CBF signals within the anatomical ROI (green) were used to create the functional ROI mask (green). Average BOLD, CBF, CMRO2 estimates were taken from the functional ROI mask for each participant. [Color figure can be viewed at http://wileyonlinelibrary.com]
