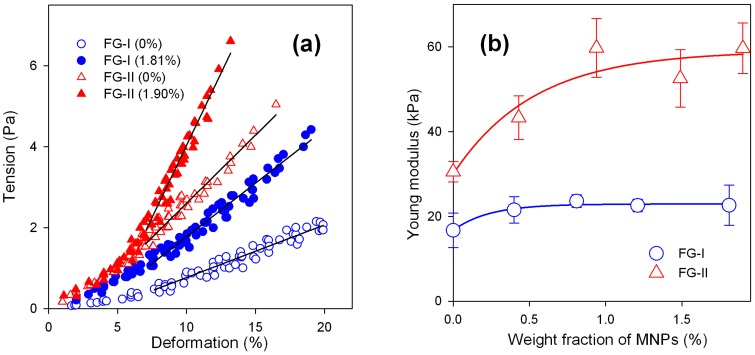
Figure 4.
Typical deformation plots for ferrogels of FG-I and FG-II series. Open symbols correspond to unfilled (blank) gel, closed symbols correspond to ferrogel with the highest concentration of MNPs. Lines show the linear parts of the plots, which were used for the calculation of the Young modulus (a); Dependence of Young modulus of ferrogel on the weight fraction of MNPs. Lines are for an eye-guide only (b).

