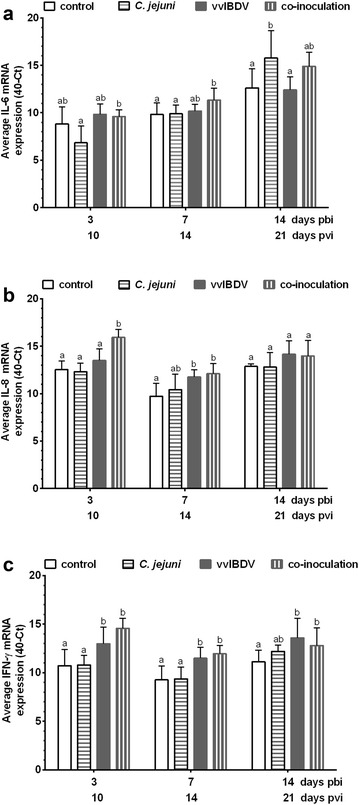
Fig. 4.

mRNA expression of IL-6 (a), IL-8-homolog (b) and IFN-γ (c) in the BF of birds of Exp. A (n = 6/group). The data is presented as 40-CT normalized to 28S. pbi post bacterial (C. jejuni) inoculation; pvi post IBDV (virus) inoculation. Error bars indicate the standard deviation (SD), abcletters indicate significant differences between groups within the same experiment at the indicated time points (P < 0.05). control = non-inoculated control, C. jejuni = C. jejuni mono-inoculated group, vvIBDV = vvIBDV mono-inoculated group, co-inoculation = vvIBDV + C. jejuni co-inoculated group
