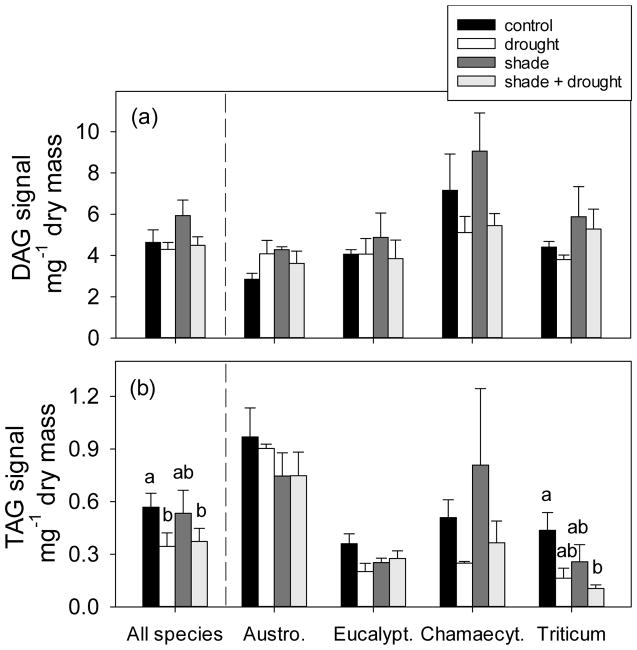
Fig. 3.
The effect of shading and drought on (a) diacylglycerols (DAGs) and (b) triacylglycerols (TAGs) in leaves of four plant species. The control is indicated by black bars, drought is indicated by white bars, shade is indicated by dark gray bars, and shade + drought is indicated by light gray bars. Means (±SE) of all species include 14–16 replicates per treatment, and individual species means (±SE) include 3–4 replicates per treatment; means are normalized to internal standards. Means not connected by the same letter are significantly different (Tukey HSD, p<0.05).

