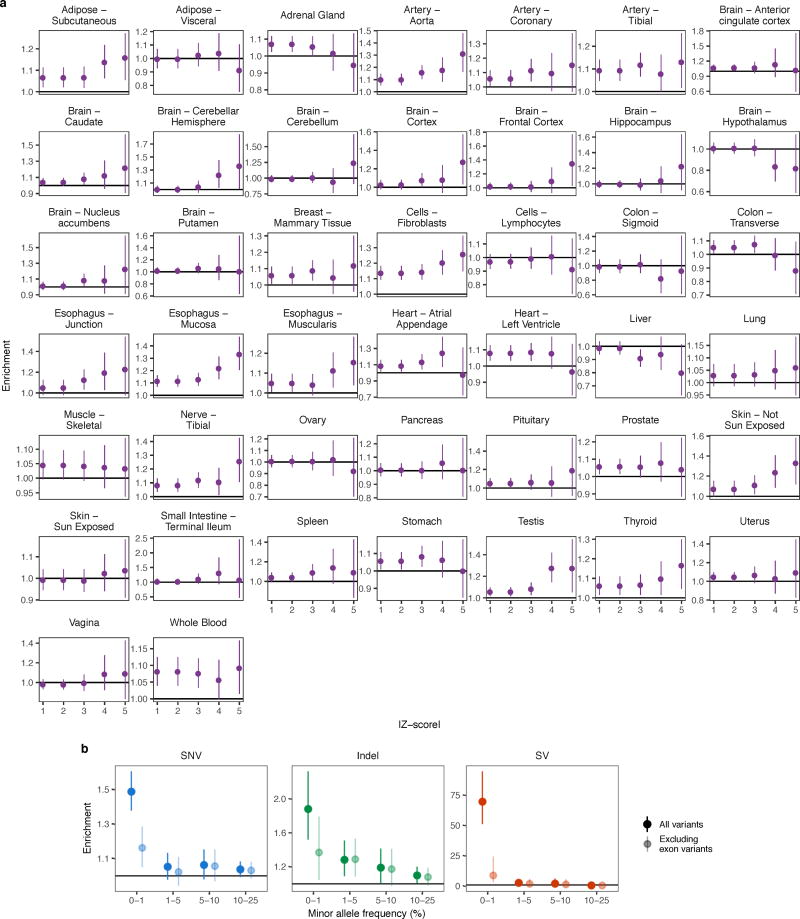
Extended Data Figure 6. Extended rare variant enrichments.
(a) For each tissue, rare SNV enrichment in single-tissue outliers compared with non-outliers at the same genes for increasing Z-score thresholds. Enrichments calculated as in Fig. 2. The rare variant enrichments varied between tissues though the overall pattern mirrored that of multi-tissue outliers when combining all the tissues (Fig. 2b). The high variance in the enrichments underscores the noise in single-tissue outlier discovery. (b) As in Fig. 2a, enrichment for SNVs, indels, and SVs in outliers compared with the same genes in non-outliers either including all rare variants or only those outside protein-coding or lincRNA exons in Gencode v19 annotation. The enrichment of rare variants was weaker, but still significant, for all variant types when excluding exonic regions.

