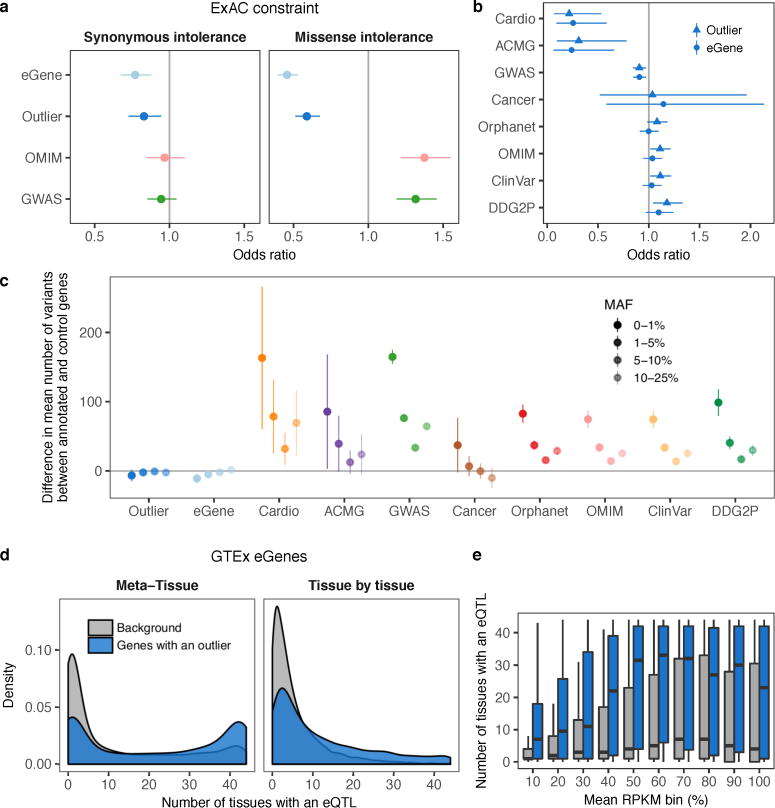
Extended Data Figure 8. Evolutionary constraint and regulatory control of multi-tissue outlier genes.
(a) Odds ratio of being intolerant to synonymous and missense variants for genes with multi-tissue eQTLs (eGenes), genes with multi-tissue outliers, OMIM, and GWAS genes (see Methods). As expected, GWAS and OMIM genes showed no enrichment or depletion for synonymous variation intolerant genes. Genes with multi-tissue outliers and eGenes showed slight depletion for these genes. Genes with multi-tissue outliers and eGenes were strongly depleted for missense variation intolerant genes compared with OMIM and GWAS genes. (b) Comparison of the depletion of disease genes among genes with a multi-tissue outlier and eGenes. Similar to Fig. 4c, bars represent 95% confidence intervals from Fisher’s exact test. (c) For each of ten gene lists, the difference in the mean number of variants near genes in the list compared with the mean for all other annotated genes. Results are stratified by minor allele frequency, and bars indicate the 95% confidence interval for the difference from a two-sided t-test. Disease genes harbored more variants than control genes in general, and the difference was particularly striking for rare variants. This suggests that the depletion of outliers and eQTLs for certain groups of disease genes is due to less rare variation near these genes. Instead, we hypothesize that the variation around these genes in our healthy cohort is less likely to have large regulatory effects. (d) Distribution of the number of tissues with an eQTL for genes with and without outliers. Genes with multi-tissue outliers had eQTLs in more tissues than genes without, which suggests that they are more susceptible to shared regulatory control. This result held for both multi-tissue eQTL definitions (see Methods; Meta-Tissue: 23 vs 3 tissues, Wilcoxon rank sum test P < 2.2 × 10⁻¹⁶; tissue-by-tissue: 7 vs 3 tissues, P < 2.2 × 10⁻¹⁶). (e) This eGene enrichment was robust across different mean expression levels across tissues (two-sided Wilcoxon rank sum tests, Bonferroni-adjusted P < 1 × 10⁻¹¹).

