
Extended Data Figure 11. Validation of large-effect rare variants via CRISPR/Cas9 genome editing.
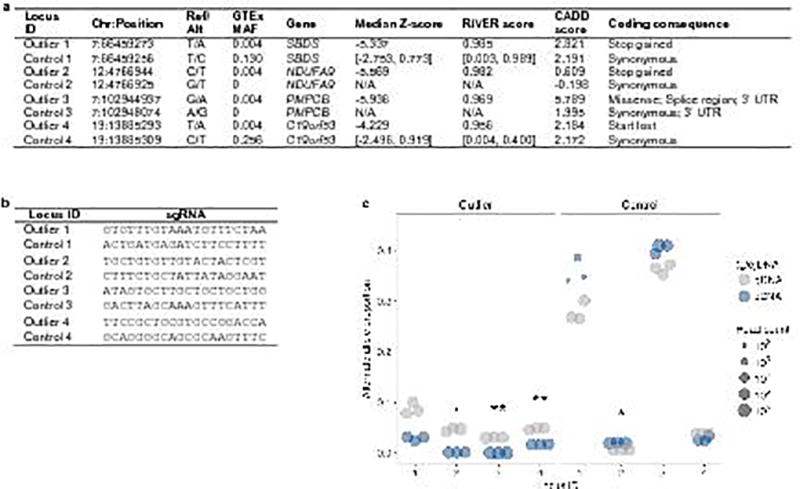
(a) SNVs in outliers and controls assayed for expression effects using CRISPR/Cas9 genome editing. For common SNVs in controls (MAF >1% in the GTEx cohort), the range of median Z-scores and RIVER scores are given for all individuals harboring the minor allele. Missing values indicate that the variant was absent from our cohort. (b) Single-guide RNAs (sgRNAs) for four SNVs found in outliers and four control SNVs in the same genes. (c) Alternate (installed) gDNA and cDNA allele proportions for four rare, coding SNVs in outliers (left) and four matched control SNVs (right). Each gDNA and cDNA sample was sequenced in triplicate (technical replicates). Asterisks denote the Bonferroni-adjusted significance level from a two-sided t-test of the difference between the gDNA and cDNA alternate allele proportions: P < 0.05 (.), P < 0.01 (*), and P < 0.001 (**). Though one control SNV showed a significant difference in the alternate allele proportion between cDNA and gDNA, it displayed an increase rather than a decrease in expression.