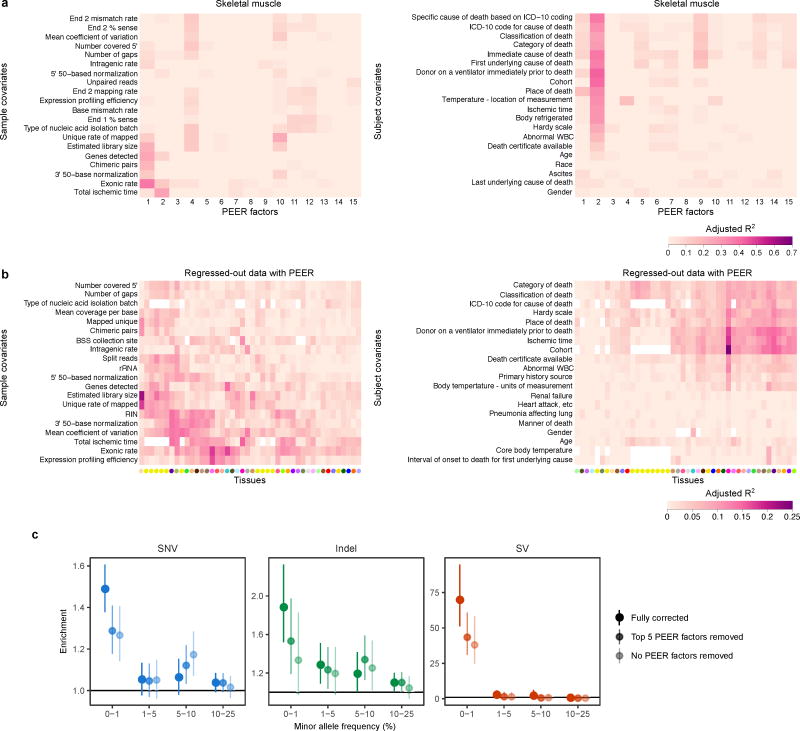
Extended Data Figure 1. PEER correction.
(a) Adjusted R2 between top 15 PEER factors and top 20 sample (left) and subject (right) covariates in an example tissue, skeletal muscle. Covariates were ranked by the average adjusted R2 across all PEER factors and hierarchically clustered. The corresponding data for all tissues are provided in Supplementary Tables 1 and 2. (b) Adjusted R2 between the total expression component removed by PEER in each tissue and top 20 sample (left) and subject (right) covariates. The covariates were ranked by the average adjusted R2 across all tissues, and both axes were hierarchically clustered. White denotes missing values, and tissues are colored as in Fig. 1. PEER factors captured slightly different covariates across tissues, with a noticeable difference between the brain and other tissues. (c) Rare variant enrichments as in Fig. 2a for different levels of PEER correction. The fully corrected data show substantially stronger rare variant enrichments than the two partially corrected datasets.

