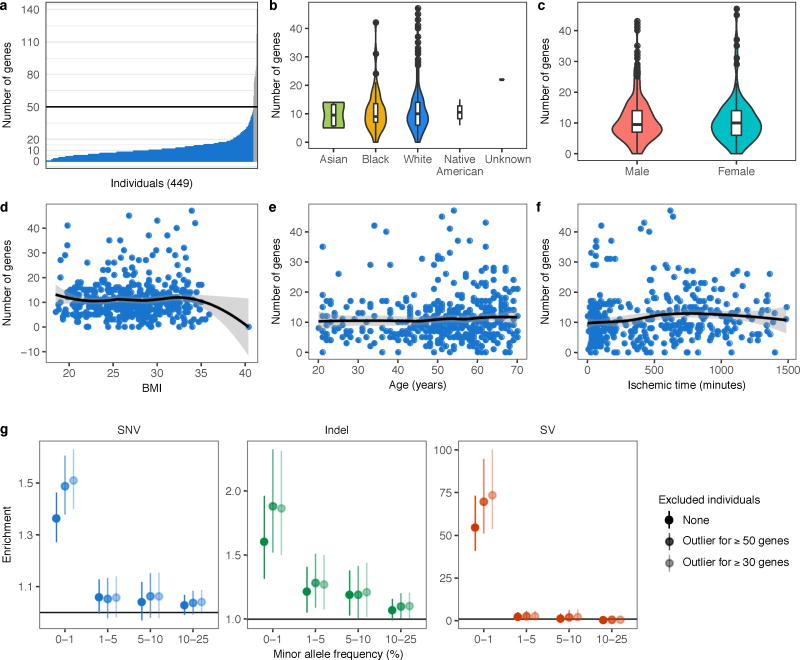
Extended Data Figure 2. Distribution of the number of genes with a multi-tissue outlier.
(a) Distribution of the number of genes for which each individual was a multi-tissue outlier. Each individual was an outlier for a median of 10 genes. Individuals with 50 or more outliers are colored in grey and were excluded from downstream analyses. (b–f) Distribution of the number of genes for which individuals, stratified by common covariates, were multi-tissue outliers. For race and sex, we compared the distributions using an unsigned Wilcoxon rank sum test, while we used Spearman’s ρ to test for association with the remaining covariates. Only age (Spearman’s ρ = 0.10, P = 0.033) and ischemic time (Spearman’s ρ = 0.18, P = 0.00022) were nominally associated with the number of outlier genes per individual. The association with age fails to achieve significance after correcting for multiple testing using the Bonferroni method. Note that in (b) we only tested for a significant difference in the distribution of the number of outlier genes between White and Black individuals because there were too few individuals in the other groups. (g) Enrichments as shown in Fig. 2a either including all individuals, or excluding individuals that are outliers for 50 (matches Fig. 2a) or 30 genes.

