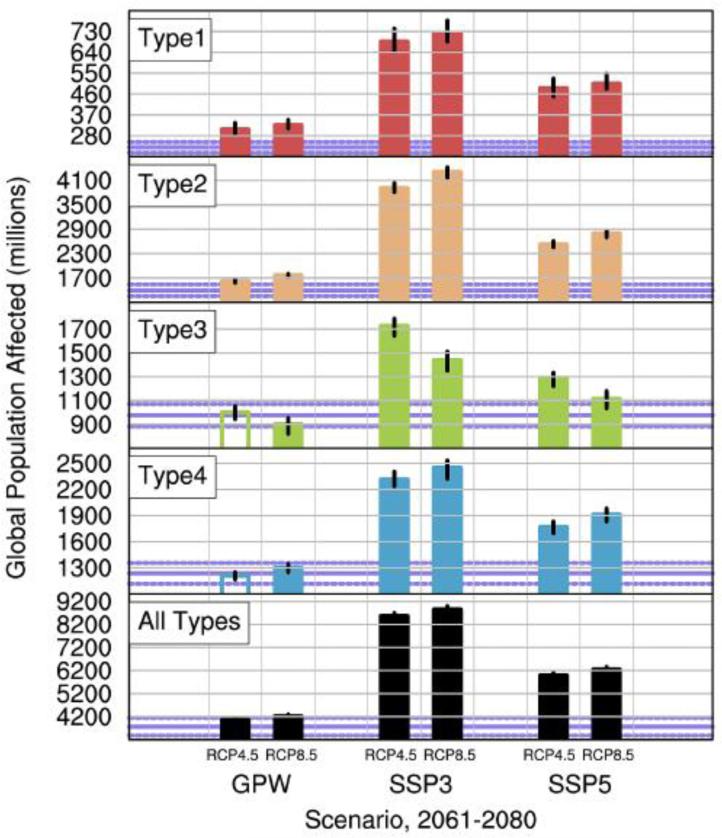
Fig. 2.
Global population affected (millions of persons) for each Ae. aegypti occurrence pattern (Types 1-4) and all patterns combined (“All Types”). Colored bars indicate the ensemble mean value, and the black lines at the top of each bar indicate the range of values among ensemble members. To aid comparison, the bar colors for each Type are identical to the colors used in the global extent map (Fig. 1a). Results are shown for the 2061-2080 RCP4.5 and RCP8.5 emissions and concentration scenarios for each of the three population pathways: GPW 2000, SSP3 2070 and SSP5 2070. Violet-colored solid horizontal lines on each panel indicate the population affected for the 1950-2000 reference period, assuming the GPW 2000 population; the dashed violet lines are +/− 2 standard deviations from the mean. Filled (unfilled) bars indicate populations statistically significantly (insignificantly) different from the 1950-2000 reference period (p<0.05)

