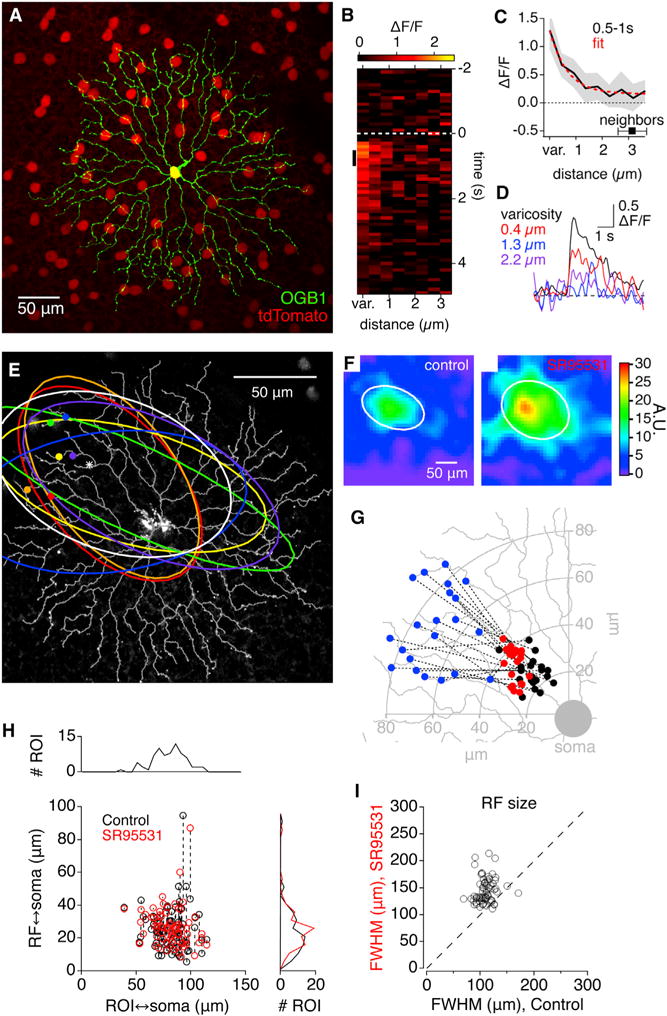
Figure 1. Visual RFs of Individual SAC Varicosities.

(A) Fluorescence micrograph of a flat-mount mouse retina expressing tdTomato (red) in SACs under control of the ChAT promoter. One SAC (green) has been filled with OGB1.
(B) x-t plot showing the spatiotemporal profile of visually evoked OGB1 Ca2+ signals averaged from 10 different varicosities on the same SAC.
(C) Average decay of OGB1 fluorescence with distance from the 10 varicosities in (B) over the time interval indicated by the black vertical line in (B). Red line indicates exponential fit. Average distance between varicosities is indicated for comparison. Distances were measured from the center of the varicosity.
(D) Average ΔF/F for the 10 varicosities versus time at 3 different distances from the varicosity center.
(E) Fluorescence micrograph of OGB1-filled SAC, with traced dendrites superimposed (gray). Symbols indicate representative individual varicosities, and the correspondingly colored ellipses indicate the half-maximal isobar of the measured RF.
(F) Example RFs, from the varicosity marked with an asterisk in (E), in control solutions (left) and in the presence of SR95531 (right). White ellipses indicate the half-maximal contour of a two-dimensional Gaussian fit.
(G) Location of RF centers, in control conditions (black) and in the presence of SR95531 (red) relative to the physical location of the varicosity (blue).
(H) Comparison of distances between the RF center and the varicosity (ROI), relative to the soma. Dashed lines connect control and SR95531 values from the same cell.
(I) Comparison of RF size (FWHM) in control and in the presence of SR95531.
See also Figures S1 and S2.
