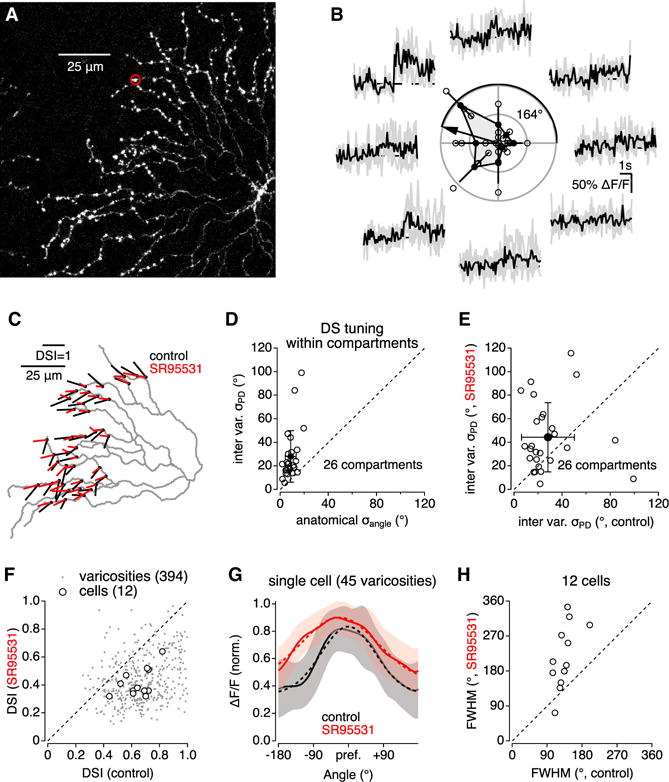
Figure 3. Neighboring Varicosities Exhibit Variable Direction Preference.

(A) Fluorescence micrograph of OGB1-filled SAC.
(B) Ca2+ signals in on varicosity (circled in A) evoked by light bars moving in eight different directions. Polar plot in center indicates individual response amplitudes (open circles), mean amplitudes (±SD) (filled circles), and vector sum oriented toward the PD.
(C) Summarized DS tuning for each of 45 varicosities on the cell in (A). Each vector originates from a measured varicosity; the amplitude and orientation of each vector correspond to the DSI and PD, respectively.
(D) PD variability between varicosities within functional compartments was larger than the range of geometric angles relative to the soma (n = 26 compartments; p = 3 × 10⁻⁵, paired t test).
(E) SR95531 increased PD variability between varicosities within individual functional compartments.
(F) Comparison of DSI in control conditions and in the presence of SR95531.
(G) Average (±SD, shaded) DS tuning curve of 45 varicosities recorded from the SAC in (A) in control and in the presence of SR95531.
(H) Summary scatterplot indicating effect of SR95531 on DS tuning width.
