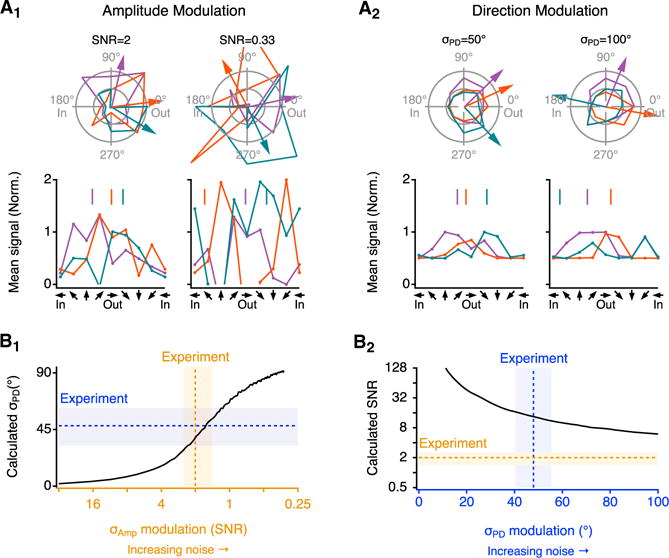
Figure 6. SAC Signal Variability Is Attributable to AM Noise.

(A) Example effects of noise on response amplitudes from a simulated SAC varicosity. Three representative simulation rounds are indicated by separate colors. Arrows (top) and vertical lines (bottom) point to the estimated PD from each round. Noise-free PD is 0° (“Out”). Parameters for AM (A1) and DM (A2) noise types were set to replicate experimental SNR and σPD, respectively (left), and higher noise levels (right).
(B) Response variability at different noise levels (B1, AM noise; B2, DM noise). In (B1), σPD was determined from 1,000 single-round repeats at each indicated SNR level. In (B2), SNR was calculated from 1,000 simulated responses to motion at PD (0°) at each σPD level. Dotted lines and shaded areas indicate the experimentally measured values (mean ± SD).
See also Figure S5.
