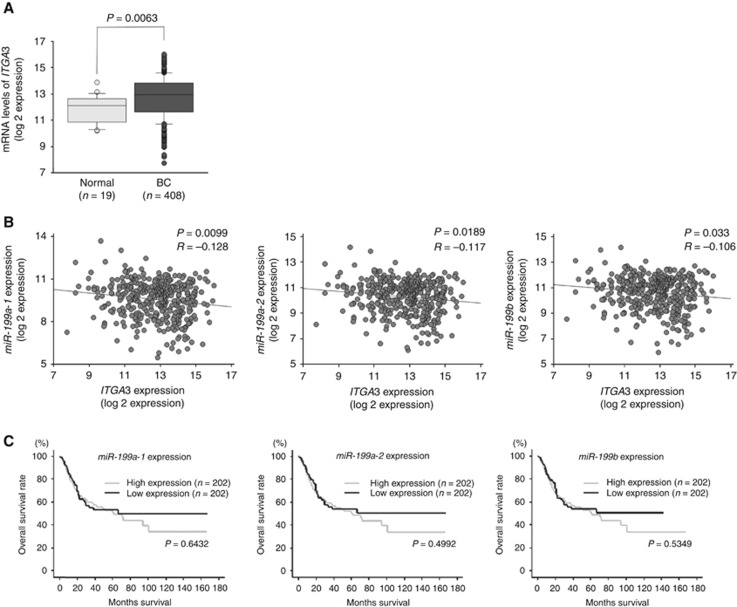
Figure 6.
Analysis of the clinical BC specimens in TCGA data sets. (A) The expression level of ITGA3 mRNA was significantly upregulated in BC tissues compared with that in normal bladder tissues (P=0.0063). (B) Negative correlations between ITGA3 expression and miR-199a-1, miR-199a-2, and miR-199b expression in BC tissues (P=0.0099, R=−0.128; P=0.0189, R=−0.117; and P=0.033, R=−0.106, respectively). (C) Kaplan–Meier analysis showed no significant differences in overall survival rates between the groups of low and high expression levels of miR-199a-1, miR-199a-2, and miR-199b frosm the TCGA cohort.

