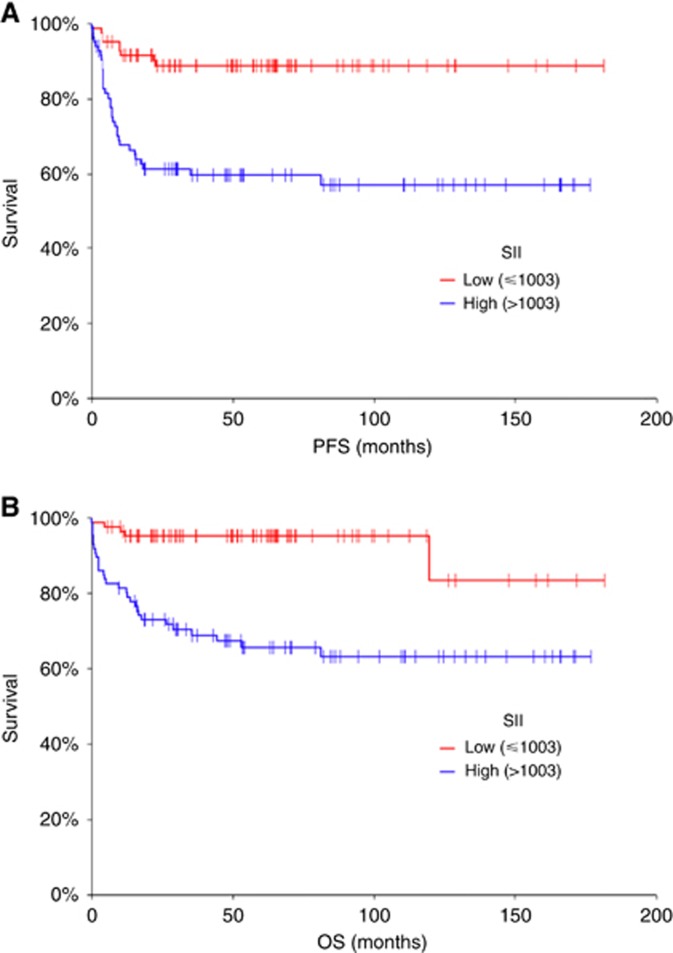
Figure 1.
Kaplan–Meier estimates of probabilities of PFS and OS according to the SII. (A) Estimates of probabilities of PFS in the discovery set of patients with GCTs (n=171), HR=0.22, 95% CI 0.12–0.41, P<0.001; low SII<1003; high SII⩾1003. (B) Estimates of probabilities of OS according to the SII; in the discovery set of patients with GCTs (n=171), HR=0.16, 95% CI 0.08–0.32, P<0.001; low SII<1003; high SII⩾1003. CI=confidence interval; GCTs=germ-cell tumours; HR=hazard ratio; OS=overall survival; PFS=progression–free survival; SII=Systemic immune-inflammation index.

