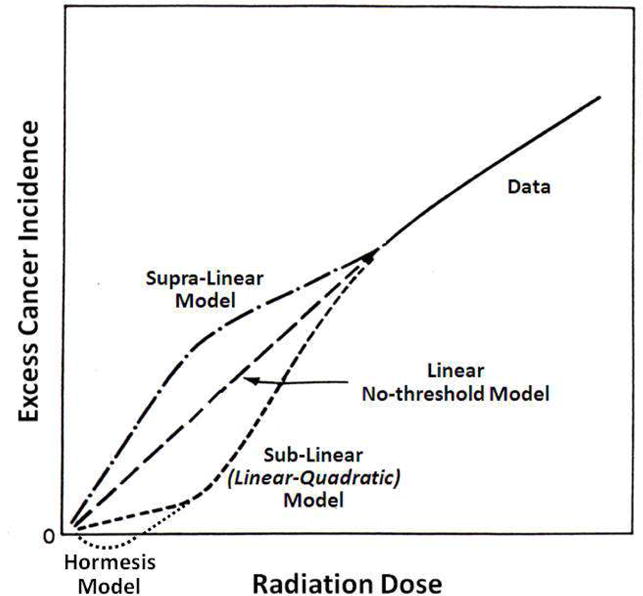
Figure 6. Dose-response curves for radiation carcinogenesis.

Stylized dose-response curves for radiation carcinogenesis for the supra-linear, linear no-threshold (LNT), sub-linear (or linear-quadratic), and hormetic models. Note that for the hormetic model the excess incidence becomes negative at low radiation doses, indicating a cancer incidence less than the naturally occurring incidence and thus a radioprotective effect.
