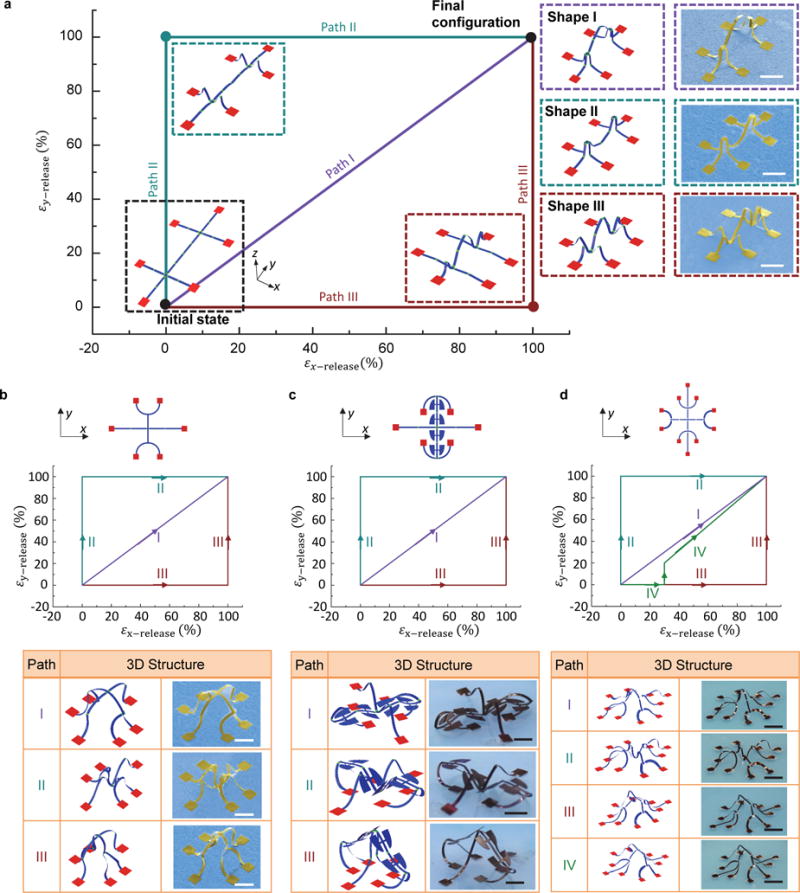
Figure 4. Morphable 3D mesostructures with multiple ( 3) stable states accessed through complex paths of sequential release.

a-d, 2D geometries, release sequences, FEA predictions and experimental images (SEM or optical) of four complex ribbon networks. The yellow and dark brown colors in the colorized experimental images correspond to SU8 (6 m for normal region and 2 m for crease), and bilayer of PET (50 m) and copper (1 m), respectively. Scale bars, 400 m for SU8 mesostructures (Fig. 4a-b), and 4 mm for PET/Cu mesostructures (Fig. 4c-d).
