
Fig. 1. Comparison of bat wing swabs (triangles), sediment samples (squares), and wall-surface swabs (circles) collected within study hibernacula for prevalence (A) and abundance (B) of Pseudogymnoascus destructans (Pd).
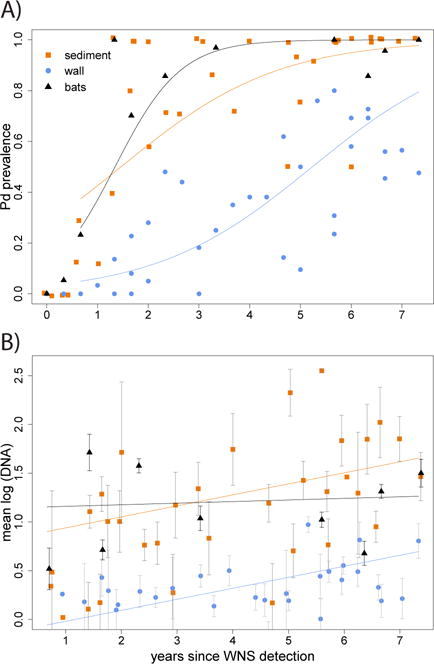
Points represent data summarized by sample type, site and time. Abundance includes Pd-positive samples only with standard errors. Solid lines are generalized linear model fits for prevalence or abundance versus WNStime and sample type. These model fits are provided for illustrative purposes to show the general trend for each sample type over time in years since first confirmation of white-nose syndrome (WNS) at a site.