
Fig. 3. Relationships between mean daily temperature range and prevalence (A) or abundance (B) of Pseudogymnoascus destructans in sediment (squares) and wall-surface swabs (circles) at sampled locations within study hibernacula.
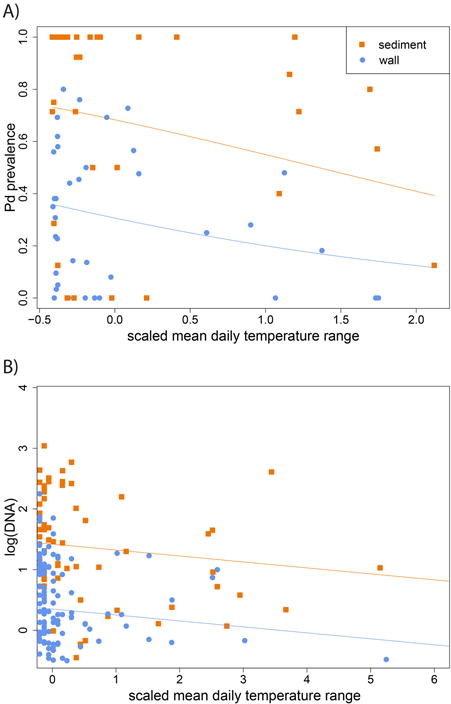
Solid lines for abundance show model fits from the best-fit model by sample type. Solid lines for prevalence represent a simplified generalized linear mixed model presented for illustration purposes. This model includes mean daily temperature range (scaled and centered) and type as covariates in a binomial distribution of prevalence weighted by sample size.