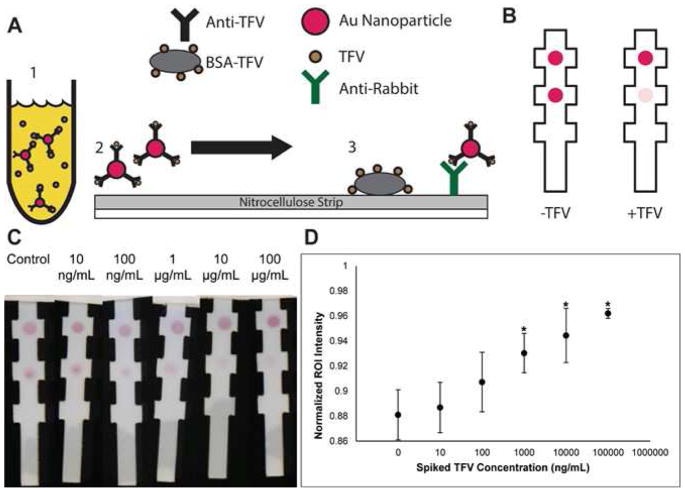
Figure 3.
A) Schematic of competitive gold nanoparticle lateral flow assay. B) Expected output of competitive gold nanoparticle lateral flow assay. As the amount of TFV increases in the sample, the test spot intensity decreases. C) Sensitivity test of competitive gold nanoparticle lateral flow assay in TFV-spiked urine samples. D) Competitive gold nanoparticle lateral flow assay statistical analysis of sensitivity test. Strips were imaged and processed using ImageJ to get background-normalized intensity measurements of test spots for varying concentrations of TFV spiked into urine. Images were converted to grayscale and intensity measurements were made with normalization to the control spots. Points with asterisks are significantly different than the no-TFV control strips as determined by one-way ANOVA (F(5,24) = 15.0, p=1.02 × 10^-6 and a Tukey test (Data from 5 Biological Replicates).

